November property market update (2024)
- Posted By Nikki Montaser
Navigating Australia's property market is becoming increasingly complex. With record-low rental vacancies in cities like Perth and Adelaide and seasonal shifts impacting markets such as Darwin, the landscape is ever-changing. As we approach the end of 2024, this update dives into key trends shaping the rental and property markets and what they mean.
Vacancy rates: record lows with regional variations
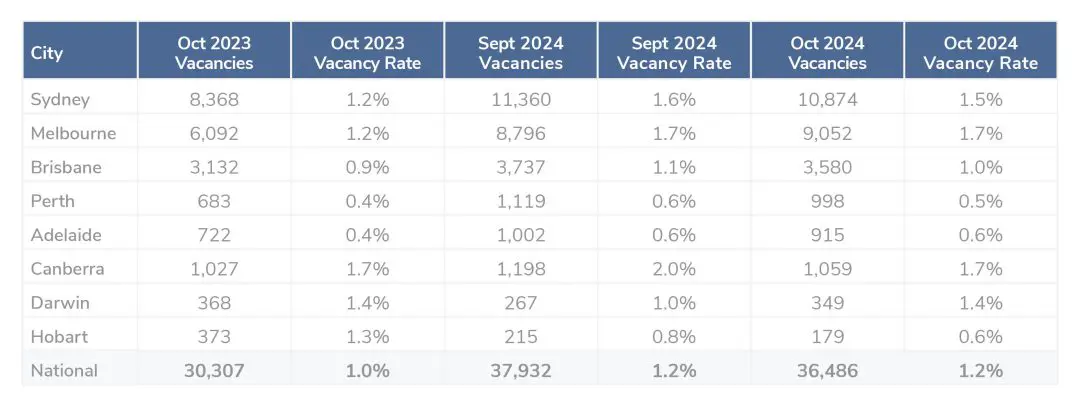
Vacancy rates remained critically low in October, holding steady at a national average of 1.2%. However, city-specific trends paint a varied picture:
- Perth: Practically no room at the inn, with vacancies at an extraordinary low of 0.5%
- Adelaide and Hobart: Both at 0.6%, with Adelaide steady and Hobart down from 0.8%
- Sydney: Slight decrease to 1.5%, reflecting continued demand
- Melbourne and Canberra: Both at 1.7%, with Canberra showing seasonal stabilisation
- Darwin: Increased to 1.4%, reflecting a typical wet-season lull
Louis Christopher, Managing Director of SQM Research, commented, “National rental vacancy rates fell slightly in October and by less than what was expected by SQM Research. The market has now reached its seasonal bottom on about 6,500 more rental vacancies than recorded this time, last year.
“Looking forward to November and the end of the year, our expectation is that national rental vacancies will rise from these levels as university students complete their semesters. There is also overall reduced tenancy demand in the seasonal lead up to Christmas.”

Rental values: national growth despite some cooling
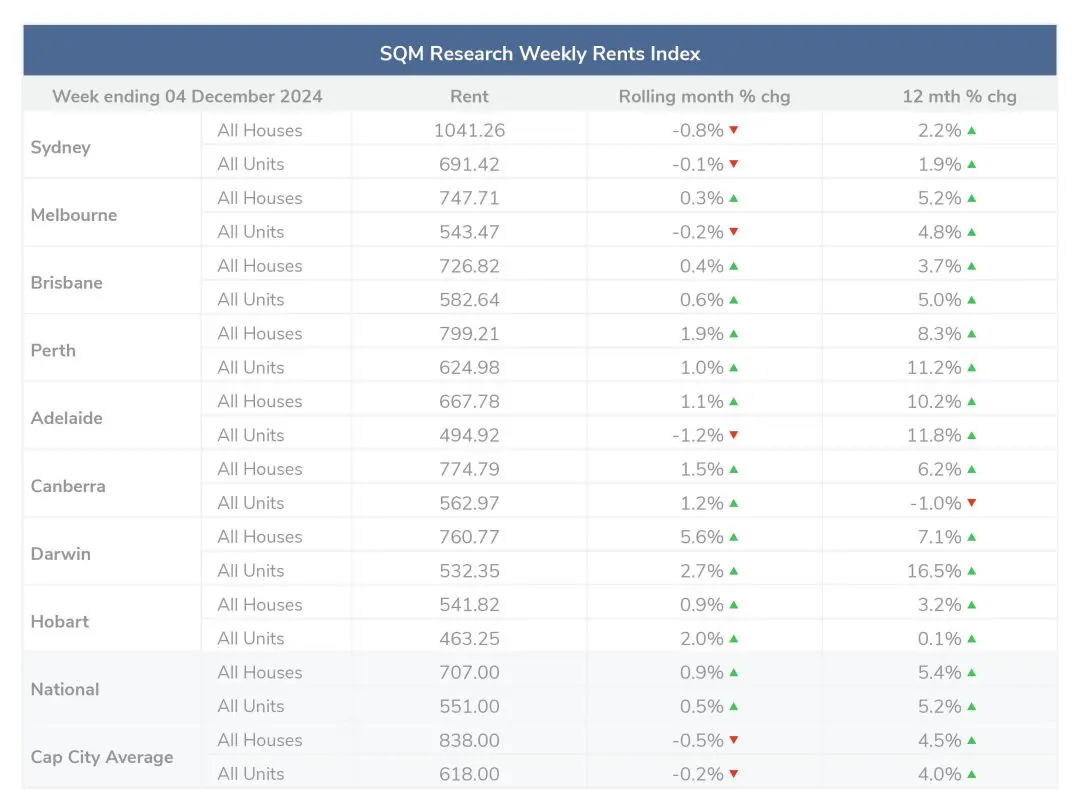
National rents continue to climb, with year-on-year increases of 5.4% for houses and 5.2% for units. Yet, monthly data reveals some softening in major capitals like Sydney, driving the overall reduction.
The national median asking rent on 4 December 2024 was $707 per week for houses and $551 per week for units. The Capital city average was $838/week for houses and $618 per week for units.
Cities like Perth and Adelaide lead rental increases, reflecting strong demand, while Sydney and Melbourne show early signs of cooling.
Rental asking prices snapshot by city:
- Sydney: Combined rents decreased by 0.1% to $836.98
- Melbourne: Fell by 0.2% to $627.09
- Brisbane: Declined by 1.1% to $657.29
- Perth: Decreased by 0.8% to $715.26
- Adelaide: Increased by 0.8% to $609.18
- Canberra: Rose by 2.3% to $655.82
- Darwin: Increased by 4.2% to $602.75
- Hobart: Slight rise of 0.4% to $505.32

Property prices: slower turnover and seller hesitation
The November property market showed mixed signals as listing activity increased but turnover slowed.
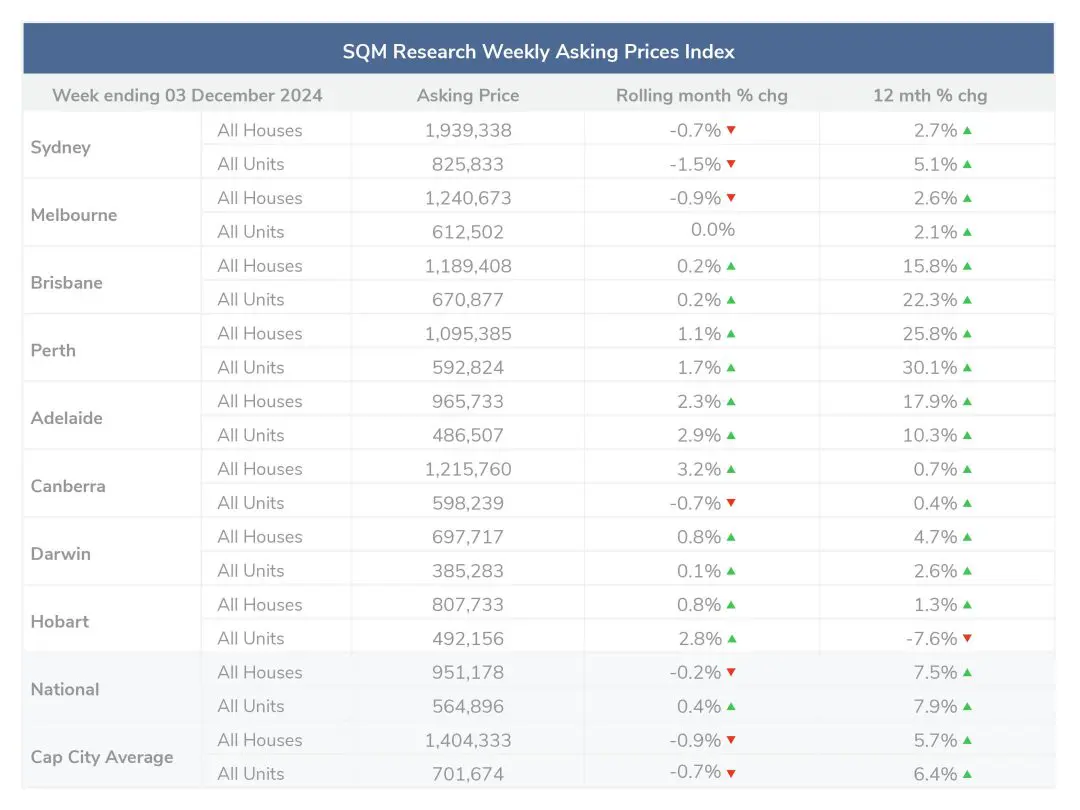
On 5 Nov 2024, the national asking price for houses was $951,178, and for units was $564,896. The capital city average asking price for houses was $1,404,333 for houses and $701,674 for units.
The SQM Research report for November 2024 highlights several key trends experienced across the past 30 days in the Australian property market.
Total listings increased
Nationwide residential property listings rose by 7.6% in November, reaching 272,645 properties. This surge was primarily due to a 6.4% increase in older listings (properties on the market for over 180 days) and a 22.6% rise in properties listed between 30 to 90 days. This trend suggests a slowdown in property turnover, leading to longer periods on the market.
New listings declined
Contrary to typical seasonal patterns, new listings (properties listed for less than 30 days) decreased by 0.4% to 82,138 in November. Notably, Sydney experienced a significant 9.7% drop in new listings. This decline could indicate potential seller hesitation.
Distressed listings rose
The number of properties listed under distressed conditions increased by 1.7% to 5,444 in November. New South Wales saw a 3.8% rise in distressed listings, while Victoria had a slight increase of 0.3%.
Capital city asking prices soften
For the 30 days leading up to December 3, capital city asking prices fell by 0.8%. Sydney and Melbourne experienced declines of 0.9% and 0.7%, respectively.
Trends vary across cities
Perth led the rise in total listings with a 20.0% increase, followed by Adelaide at 16.7%, and Hobart at 12.2%. Conversely, Darwin was the only city to see a decrease in listings, down by 2.7%.
Key takeaways:
- Sellers face longer listing periods, with fewer buyers transacting.
- Sydney and Melbourne recorded lower vendor confidence, reflected in asking price declines of 0.9% and 0.7%, respectively.
- Meanwhile, Perth, Adelaide and Hobart saw notable increases in overall listings, signalling shifting dynamics in smaller markets.

Cash rate and predictions: no end in sight for high rates
On 6 November 2024, the RBA held the cash rate target steady at 4.35%, citing ongoing inflationary pressures “Underlying inflation remains too high… The forecasts published today are very similar to those published in August. The forecast path for underlying inflation reflects a judgement that aggregate demand remains above the economy’s supply capacity, evidenced by the persistence of underlying inflation, surveys of business conditions and ongoing strength in the labour market.”
What this means:
- Borrowers may face continued affordability challenges.
- Property investors could see constrained borrowing capacity, impacting both purchase and refinancing activity.
- As demonstrated in November, distressed listings could continue to rise.
Looking ahead
According to Louis Christopher, Managing Director of SQM Research, as we approach the Christmas and summer holiday seasons, the market is expected to see typical seasonal patterns:
- New listings: Likely to slow significantly in late December.
- Summer hotspots: Regions like the Gold Coast could see a surge in activity in January.
Louis Christopher, Managing Director of SQM Research said, “As predicted, this year’s spring selling season recorded higher listings activity than 2023 with total listings up by 4.6% compared to Spring 2023. However, this was mainly driven by a rise in older listings. New listings were just up by 1.8% to 242,218 new listings for the period.
“This will be slightly disappointing news to many real estate agents who were counting on a stronger selling season than what has actually happened. Clearly the housing market has slowed down, particularly in Sydney and Melbourne where we are recording lower vendor confidence as measured by our asking prices index which fell a further 0.9% for Sydney and 0.7% for Melbourne.
“Going forward, new listings are very likely to fall away in the lead up to Christmas with the typical hiatus period occurring between the 23rd of December through to Australia Day. The first major auction weekend will likely be the 1st of February. However, we should note that summer holiday locations such as the Gold Coast tend to have their busiest period of the year in January and this coming January will be no exception to that tradition.”
Disclaimer: The information enclosed has been sourced from SQM Research and Reserve Bank of Australia, and is provided for general information only. It should not be taken as constituting professional advice.
PropertyMe is not a financial adviser. You should consider seeking independent legal, financial, taxation, or other advice to check how the information relates to your unique circumstances.
We link to external sites for your convenience. We are selective about which external sites we link to, but we do not endorse external sites. When following links to other websites, we encourage you to examine the copyright, privacy, and disclaimer notices on those websites.
Article posted by Property Me.

