October property market update (2024)
- Posted By Nikki Montaser
Vacancy rates decreased to 1.2% in September with marginal change to asking rents. Sales asking prices also experienced marginal movement, with an increase in total property listings, including distressed listings.
Vacancy rates
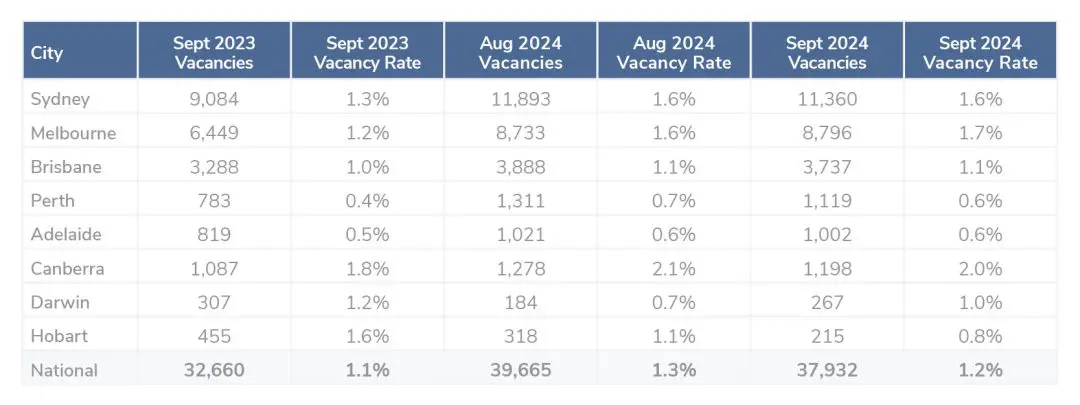
In September 2024, SQM Research reported a slight decline in Australia’s national residential vacancy rate to 1.2%, with the total number of rental vacancies decreasing to 37,932 properties from 39,665 in August.
Sydney’s rental vacancy rate remained stable at 1.6%, with 11,360 vacant dwellings, while Melbourne’s rate increased to 1.7%, totaling 8,796 vacant dwellings.
Canberra recorded the highest vacancy rate among the capitals at 2.0%, a slight decrease from August. Perth’s vacancy rate decreased to 0.6%, and Adelaide maintained one of the lowest rates at 0.6%.
Louis Christopher, Managing Director of SQM Research said, “National rental vacancy rates fell slightly again in September, and we are expecting another fall in October. However, this will mainly be a seasonal change and so, we are not anticipating a reacceleration of rents for now, which have eased in recent months.
“However, the national rental market remains in severe shortage and barring some exceptions, is not expected to materially soften out of the rental crisis for some years.
“Ongoing strong migration growth, initially forecasted by SQM to materially slow in 2024 towards Federal Budget targets, has not materially slowed. Total population expansion for this current calendar year is now expected to be higher than 500,000 people; and so, this rapid population growth will continue to keep pressure on the rental market.”

Rental values
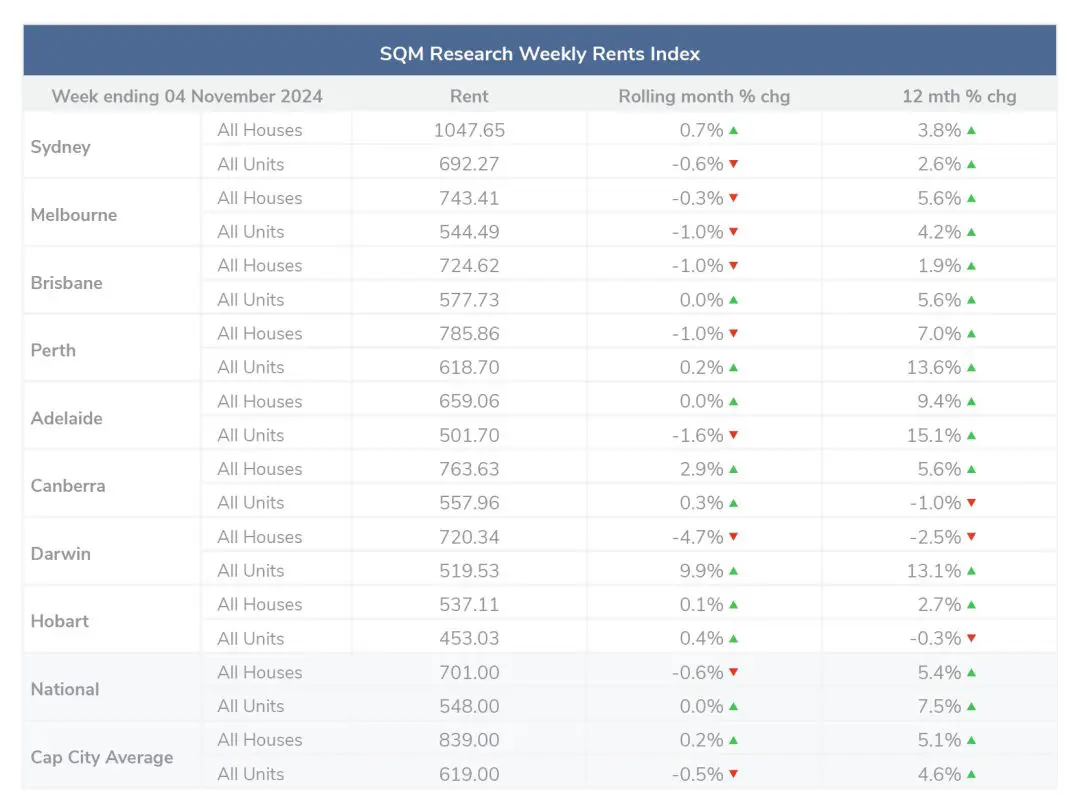
Over the past 30 days to 4 November 2024, the national median asking rents for houses decreased by -0.6% and remained steady for units for the second consecutive month. Across capital cities averages, the median asking rent increased marginally by 0.2% and units decreased by -0.5%, with varied changes seen across the capitals.
- Canberra and Hobart experienced increases in both houses and units
- Sydney, Brisbane, Perth, Adelaide and Darwin experienced mixed results across houses and units
- Melbourne experienced decreases across both houses and units
The largest variation in results was seen in Darwin for the second consecutive month with houses decreasing by -4.7% and units increasing by 9.9%.
The average national rental asking price at 4 November 2024 was $701 for houses and $548 for units. Compared to last year, the national rental asking prices increased by 5.4% for houses and 7.5% for units.
The capital city average rental asking price at 4 November 2024 was $839 for houses and $616 for units. Compared to last year capital city asking prices increased by 5.1% for houses and 4.6% for units.

Property prices
According to SQM Research’s October 2024 report, the Australian property market exhibited the following key trends:
Mixed trends for asking prices
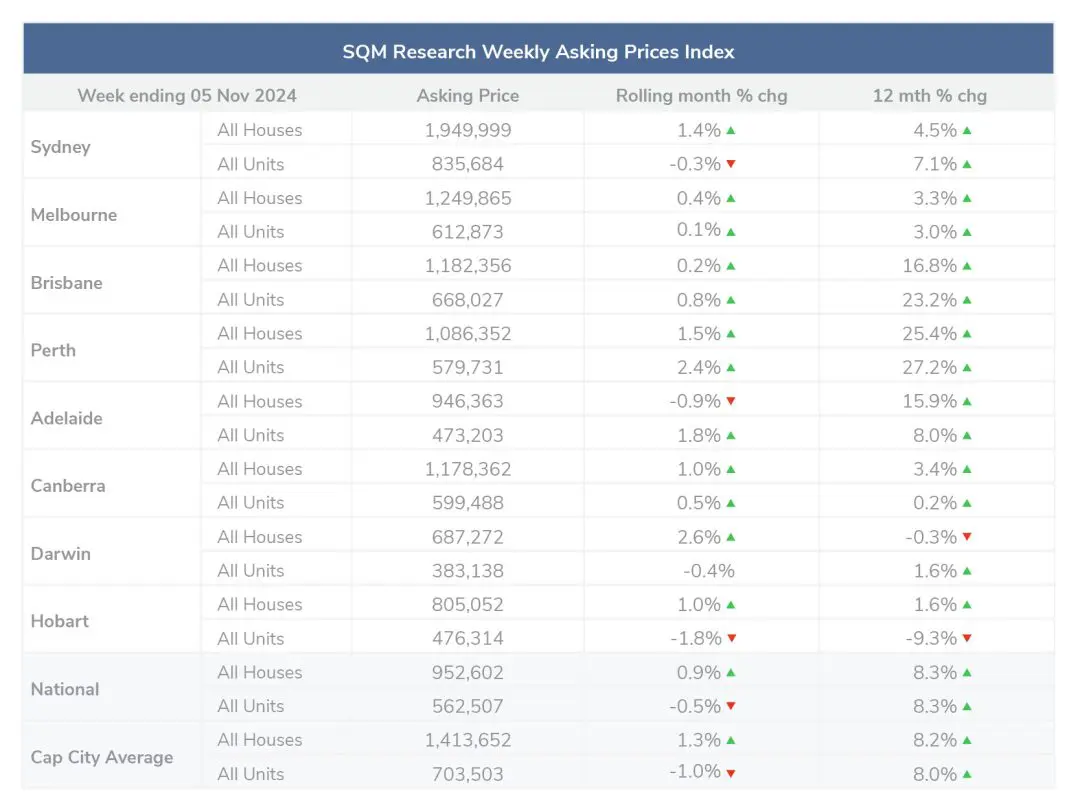
Nationally asking prices across the past 30 days increased by 0.9% for houses and decreased by -0.5% for units. Similarly, capital city asking prices increased by 1.3% for houses and decreased -1.0% for units.
This trend reflects varying market dynamics across different cities, with some areas experiencing more significant price increases than others.
- Melbourne, Brisbane and Canberra experienced increases in both houses and units;
- Sydney, Adelaide, Darwin and Hobart experienced mixed results across houses and units
At 5 Nov 2024, the national asking price for houses was $952,602 and for units was $562,507. The capital city average asking price for houses was $1,413,652 for houses and $703,503 for units.
Additional insights include:
An increase in total property listings nationally by 3.9% in October 2024, reaching 253,327 properties. Perth led this increase with a 10.0% rise, Darwin was the only city to see a decrease, with listings down by 2.7%.
An increase in new property listings (less than 30 days) by 6.2% nationally, totaling 82,458 properties. Hobart recorded the largest monthly increase at 34.5%, Sydney, however, experienced a slight decline of 0.6% in new listings.
A decline in older listings nationally, as properties listed for over 180 days decreased by 1.2% from the previous month, totaling 69,658 properties. Adelaide saw the most significant drop at 12.0%, while Hobart, Canberra, and Sydney recorded increases in older listings.
An increase in distressed listings. The number of residential properties sold under distressed conditions rose by 3.3% to 5,351. Victoria experienced a notable increase of 5.6%, while New South Wales saw a decrease of 2.6%. Western Australia and South Australia both recorded significant increases of 10.5% and 10.3%, respectively.
Louis Christopher, Managing Director of SQM Research said, “Overall, residential property listings activity was stronger in October, driven by some large increases in Melbourne, Perth, Adelaide and Canberra.
“And notably, we have recorded a rather large rise in Victorian distressed selling activity, both on a monthly and annual basis. While the counts are still low compared to pre-covid periods, we will be monitoring these results very closely going forward as it could be an early sign of an increase in the number of Melbourne property owners struggling.
“Going forward, SQM is expecting another rise in listings for November as the spring selling season hits its peak. We remain confident listing levels will be up this spring compared to previous years.”

Cash rate and predictions
The RBA did not meet in October. On 5 November 2024, the RBA held the cash rate target at 4.35% stating, “Underlying inflation remains too high… The forecasts published today are very similar to those published in August. The forecast path for underlying inflation reflects a judgement that aggregate demand remains above the economy’s supply capacity, evidenced by the persistence of underlying inflation, surveys of business conditions and ongoing strength in the labour market.”
Disclaimer: The information enclosed has been sourced from SQM Research and Reserve Bank of Australia, and is provided for general information only. It should not be taken as constituting professional advice.
PropertyMe is not a financial adviser. You should consider seeking independent legal, financial, taxation, or other advice to check how the information relates to your unique circumstances.
We link to external sites for your convenience. We are selective about which external sites we link to, but we do not endorse external sites. When following links to other websites, we encourage you to examine the copyright, privacy, and disclaimer notices on those websites.
Article posted by Property Me.

